


A/B testing - Case Study on button color
Comparing Variants to Drive Data-Driven Decisions

What is A/B testing?
A/B testing is an experimental method where two versions of a variable (A and B) are compared to determine which performs better in achieving a specific goal, based on data-driven evidence.
As an example let’s say a new product feature has been launched and as seen below, the company’s revenue has been on an upward trend. How do we know how much of the revenue is direct contribution is from the new feature launch?

The answer is to perform A/B testing.
A/B testing helps determine the true impact of the new feature by comparing the revenue trend with and without the feature. Without a controlled experiment, it's challenging to separate the feature’s direct contribution from other external factors driving growth. If the feature had not been launched, revenue might still rise, but at a potentially slower rate, implying that part of the increased growth rate could be attributed to the new feature's influence as can be seen from the graph below.

Why and when should you run A/B test?
Deciding whether or not to launch a new product/feature
To quantify the impact of the product or feature
Compare the data with intuition i.e better understand how users respond to certain parts of the product
10 steps to set up an A/B test
Define your goal and form your hypothesis
Identify the control and treatment
Identify key metrics to measure
Identify what data needs to be collected
Make sure that appropriate logging is in place to collect all the necessary data
Determine how small of a difference you would need to detect
Determine the fraction of the visitors you want to be in treatment
Run Power Analysis to decide how much data you will need to collect and how long you will need to run the test
Run the test for ATLEAST this long
First time trying something new: run an A/A test (dummy test) simultaneously to check for systematic bias
Case Study: Testing a Red CTA vs Green CTA
This is a classic A/B testing case study.
Let’s say your website has red ‘Buy Now!’ button. The marketing team predicts that a green color would be better as it reflects the brand color and consumer would find that appealing. To test this hypothesis, let’s plan to use the A/B test with steps outlined above.

Step1: Define goal and form hypothesis
Goal: Quantify the impact a different call-to-action button color has on metrics.
Hypothesis:
Compared with red CTA button, a green CTA button will entice users to click who would not have had otherwise
A fraction of these additional clickers will complete the transaction, increasing revenue
We expect the change in behavior to be more profound in mobile
Null hypothesis:
Green button will cause no difference in Click Through Rate or other user behaviour
Step 2: Identify the treatment and control
Control: Red button which is already present
Treatment: Green button
Only the color is changed and the rest of the features are unchanged for treatment.
Step 3: Identify key metrics to measure
Revenue
Purchase Rate: Purchase per visitor OR purchase per clicker
Click Through Rate: Click per visit Or clickers per visitor
Other behaviour metrics:
Bounce rate
Time on site
Return visits
Engagement with other parts of the website
Referrals
Step 4: Identify the data to collect
User id
Cookie id
What platform the visitor is on
Page loads
Experiment assignment
If the user sees a button, and which color
Clicks on the button, and which color
Data for other metrics (i.e engagement behaviour)
Step 5: Make sure logging in place
Does it work on mobile? How does it work if user is logged out?
What happens if you press ‘back’ button?
What happens if some other experiment is triggered as well?
Does the logging interfere with any other logging?
Step 6: Determine how small of a difference needs to be detected
Current button CTR: 3%
Successful experiment: 3.3% or more
This means that we would need to collect enough data to measure 10% increase
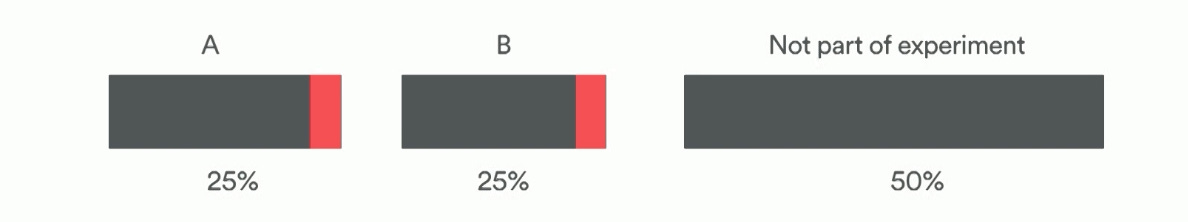
Step 7: Determine what fraction of visitors you want to be in the treatment
50/50 splits are the easiest and take the least amount of time to run, but you might not always want to do that. For instance, there could be some probability that the green button might not yield good results and in fact, may lead to decline in revenue which could make the decision makers test on a fraction of overall population instead of half of the population. In that case, the split could be 90% control and 10% treatment. However, uneven split would mean that more data would need to be collected.
Step 8: Calculate how much data to collect and how long you need to run the experiment for
Run a power analysis to decide how many data samples to collect depending on your tolerance for:
Minimum measurable difference (10% in this case)
False Positives
False Negatives
False Positive (Type I error): we see a significant result when there is not one.
Falsely reject the null hypothesis
Typicaly, we want a false positive rate < 5%: a = 0.05
False positive rate is equivalent to the significane level of a statistical test
False negative (Type II error): there is an effect, but we were not able to measure it
We should reject the null hypothesis, but don’t.
Typically, we want the false negative rate to be <20%: B = 0.2
The ‘power’ of the test is 1-B = 0.8
The tolerance for False negative is slightly higher than False positive because of the business consequences. It is generally good to be conservative and maintain the status quo even if there is a Type II error as that would be more of a ‘missed opportunity’. However, rolling out changes for better but instead is actually worse would be bad idea for the business leading to higher loss.
Ideally, we would want both False positive and negative to be low. To acheive that, test have to run a lot longer and lots of data needs to be collected which is not always feasible.
Power Calculation:
Any statistical program should be able to provide this calculation to determine the sample size. Here is an example in R:
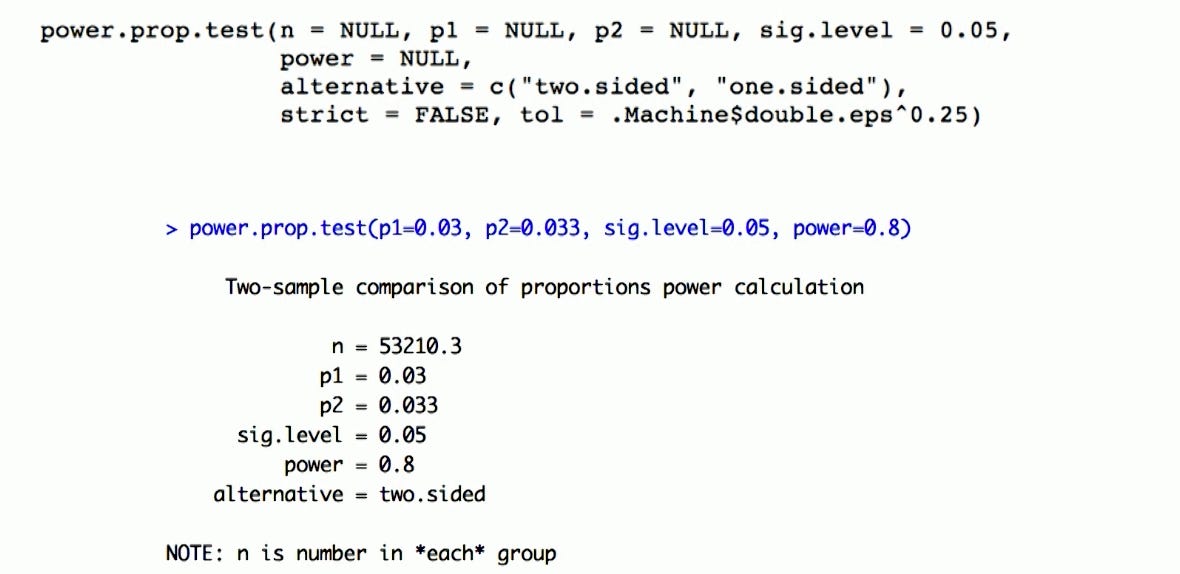
p1: Control CTR
p2: Treatment CTR
sig.level: Type I error (False Positive Rate)
power: 0.8 (1-Type II error)
Step 9: Figure out how long to run the test and run for AT LEAST that long
From previous step, the result is that we would need to collect 53,210 samples for each group.
Given this information, we need atleast 53,210*2 = 106,420 users
If the traffic on website is ~100,000 unique users/day, we need to run the test for atleast 1 day.
Note: If we were to run 90/10 test, we would need 53,210*10 = 532,100 users.
Do not stop the test too early, because some of the effect seen could actually be a result of statistical variance. This is considered the classic p-value peeking problem. The statistical significance resulting from the p-value peeking is likely to be a False Positive.
If the users are not required to log in, they may be in more than one experiment group! For instance, if a same user uses two different devices (mobile or home), then it is possible that the user sees two different buttons or was placed in two different groups. Dealing with such cases is to identify such mixed group users and removing them from the experiment.
This problem of mixed user can be worse in case of uneven treatment groups as the probability of switicing from one device to other increases as shown as follows:

The solution to this is to make sure to have an even treatment and control groups.
Step 10: if this is your first time, run a dummy test
You should see something like this for your metrics over time:

One way to identify biases such as this is to run a dummy test. So, if this your first time running an A/B test or doing something different such as uneven group sizes, then you should always run a dummy test at the same time or beforehand.
Dummy test is like a A/B test but there is no difference between treatment or control, and they actually see exactly the same thing. If the groups are measured overtime, even through there might be some statistical fluctuations, there should not be any differences in the metrics being tracked. If there is a difference then that implies something is wrong with the way experiment is conducted.
Summary:
Run power analysis to determine how long to run test
Don’t stop the test too early! Let the test run its courses and avoid p-value peeking issue
If users do not have to be logged in to be a part of the experiment, you can have problems with mixed group users.
To avoid systematic biases, make sure that you have even treatment and control groups